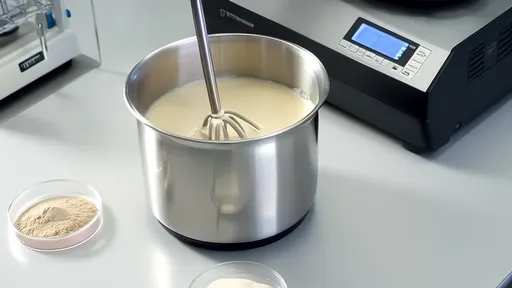
Understanding the behavior of wheat flour during dough formation is a cornerstone of modern baking science. Among the most revealing tools for this analysis is the farinograph, a device that measures the resistance of dough as it's mixed. The resulting farinogram curve tells a nuanced story about flour quality, water absorption, and dough stability—critical factors that determine how flour will perform in everything from crusty baguettes to tender cakes.
The farinograph curve begins with hydration, as flour and water first interact. The initial upward slope reflects the rapid absorption of water by gluten-forming proteins. A steep ascent indicates strong, high-protein flour that quickly develops a robust gluten network. Conversely, a gentler slope suggests weaker flour, often preferred for delicate pastries where excessive chewiness would be undesirable. This early stage of the curve reveals the flour's water absorption capacity—the precise amount of water needed to reach optimal dough consistency, typically expressed as a percentage of flour weight.
As mixing continues, the curve reaches its peak at what technologists call the peak time. This moment represents the point of maximum dough development, when gluten strands have organized into an elastic network but haven't yet begun to break down. Industrial bakers pay particular attention to this measurement, as it dictates optimal mixing duration for large-scale production. Flours with long peak times (6-8 minutes) suit artisan bread requiring extended fermentation, while short peak times (2-3 minutes) indicate flour better suited for quick breads or cookies.
The descending portion of the curve tells perhaps the most cautionary tale. As mechanical work continues beyond the peak, gluten strands begin to tear. The rate of this decline measures the flour's mixing tolerance—its ability to withstand overmixing. A gradual slope suggests stable flour that maintains structure despite processing variations, while a sharp drop warns of fragile gluten that demands precise mixing control. Commercial bakeries operating high-speed mixers particularly value flours with strong mixing tolerance to accommodate inevitable production fluctuations.
Between the initial water absorption and eventual breakdown lies the curve's most stable segment—the stability time. This plateau represents the duration during which dough maintains optimal resistance. Long stability (10+ minutes) indicates flour capable of enduring lengthy fermentation and multiple handling steps, ideal for sourdough or frozen dough applications. Short stability (under 4 minutes) suggests flour best used in quick, streamlined processes where extended dough handling isn't required.
The curve's tail end, where resistance continues to decrease, reveals the flour's weakening rate. This measurement becomes crucial when evaluating flour for laminated doughs or products requiring sheeting. A slow weakening rate indicates flour that will maintain elasticity through multiple folds and turns, while a rapid decline suggests gluten that becomes too extensible for such applications. Pastry chefs working with croissants or puff pastry carefully consider this characteristic when selecting flour.
Beyond these primary features, subtle curve variations speak volumes to experienced millers. The presence of multiple small peaks might indicate uneven protein quality or the need for oxidation adjustment. An unusually wide band between upper and lower curves could signal inconsistent hydration. These nuances become particularly important when blending flours or developing new wheat varieties, where the farinogram serves as both quality control tool and research instrument.
Modern interpretations of farinograph data increasingly incorporate digital analysis, with algorithms detecting patterns human eyes might miss. However, the fundamental relationship between curve morphology and baking performance remains unchanged. Whether formulating flour for chewy bagels or tender biscuits, the farinograph curve continues to provide indispensable insights—a graphical language that translates wheat's complex biochemistry into practical baking knowledge.

By /Jul 24, 2025
By /Jul 24, 2025
By /Jul 24, 2025

By /Jul 24, 2025
By /Jul 24, 2025
By /Jul 24, 2025
By /Jul 24, 2025
By /Jul 24, 2025

By /Jul 24, 2025
By /Jul 24, 2025

By /Jul 24, 2025
By /Jul 24, 2025

By /Jul 24, 2025
By /Jul 24, 2025
By /Jul 24, 2025
By /Jul 24, 2025

By /Jul 24, 2025
By /Jul 24, 2025
By /Jul 24, 2025
By /Jul 24, 2025